Topographic maps are essential tools used by geographers, hikers, planners, and various other professionals to understand and navigate different types of terrain. These maps provide a detailed representation of the earth’s surface, showing elevation changes, landforms, and natural features. Understanding how topographic maps represent various types of terrain is crucial for interpreting the information they provide accurately.
Mapping Elevation Changes
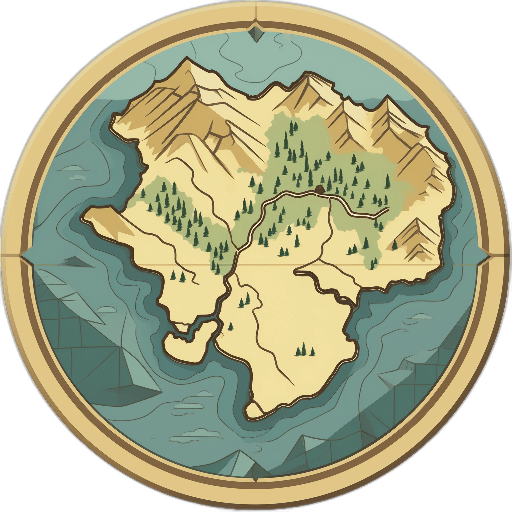
One of the key features of topographic maps is their representation of elevation changes. Through the use of contour lines, these maps depict the vertical relationship between different points on the terrain. Contour lines connect points of equal elevation, allowing users to visualize the shape of the land and identify slopes, valleys, and peaks. The spacing of contour lines indicates the steepness of the terrain, with closely spaced lines representing steep slopes and widely spaced lines indicating more gradual inclines.
Different types of terrain, such as mountains, plateaus, and valleys, can be easily identified on a topographic map based on the arrangement and pattern of contour lines. For instance, a series of concentric circles on a map typically represent a mountain or hill, with the lines getting closer together as they approach the summit. In contrast, wide-spaced contour lines may indicate a flat or gently sloping terrain characteristic of a plateau.
Mapping Water Features
Topographic maps also represent different types of terrain by illustrating water features such as rivers, lakes, and marshes. Blue lines on a map typically represent water bodies, while symbols and shading may be used to indicate the direction of flow, depth, or type of water feature. Rivers are shown as blue lines with arrows indicating the direction of the water flow, while lakes are depicted as filled blue areas.
In addition to rivers and lakes, topographic maps also highlight wetlands, swamps, and other waterlogged areas that may impact travel and development in certain regions. By understanding how water features are represented on a map, users can better plan routes, assess flood risks, and identify areas with unique ecological characteristics.
Mapping Vegetation and Land Use
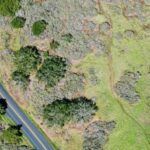
Another way topographic maps represent different types of terrain is by illustrating vegetation cover and land use patterns. Using symbols, colors, and shading, these maps depict forests, grasslands, agricultural areas, urban developments, and other land cover types. By analyzing the distribution of vegetation and land use on a map, users can gain insights into the natural environment, human activities, and potential land management strategies.
For example, dense green areas on a topographic map may indicate forests or woodlands, while lighter green shades could represent grasslands or meadows. Urban areas are typically shown with a combination of colors and symbols to differentiate between residential, commercial, industrial, and recreational zones. By interpreting these representations, planners and environmentalists can make informed decisions about conservation, development, and resource management.
Mapping Cultural Features
Topographic maps also capture cultural features such as roads, buildings, boundaries, and infrastructure, which play a vital role in understanding and navigating different types of terrain. Roads and highways are depicted as thin lines of varying colors, while buildings, bridges, and landmarks are represented by symbols or labels. Political boundaries, administrative divisions, and property lines are demarcated using dashed lines or different colors.
By incorporating cultural features into their representations, topographic maps provide a comprehensive view of the built environment and human activities within a specific area. This information is valuable for urban planning, emergency response, tourism, and various other applications that require an understanding of both natural and man-made features on the landscape.
Mapping Specialized Terrain
In addition to general terrain features, topographic maps can also represent specialized terrain types such as glaciers, deserts, volcanic regions, and coastal areas. These unique landscapes present specific challenges and opportunities for exploration, research, and conservation, requiring detailed mapping and analysis to understand their characteristics and dynamics.
Glaciers are depicted on topographic maps through a combination of contours, shading, and specific symbols that indicate ice formations, crevasses, and moraines. Deserts are represented by sparse vegetation cover, sand dunes, and arid conditions, while volcanic regions may show craters, lava flows, and volcanic cones. Coastal areas feature a combination of land and water features, including beaches, cliffs, estuaries, and coral reefs, which are essential for navigation, marine conservation, and disaster preparedness.
In conclusion, topographic maps offer a rich and detailed representation of different types of terrain by capturing elevation changes, water features, vegetation, land use, cultural elements, and specialized landscapes. By interpreting the information presented on these maps, users can navigate diverse environments, plan development projects, conduct research, and appreciate the beauty and complexity of the earth’s surface. Understanding how topographic maps represent terrain is essential for anyone seeking to explore, study, or protect the natural and cultural landscapes that define our world.